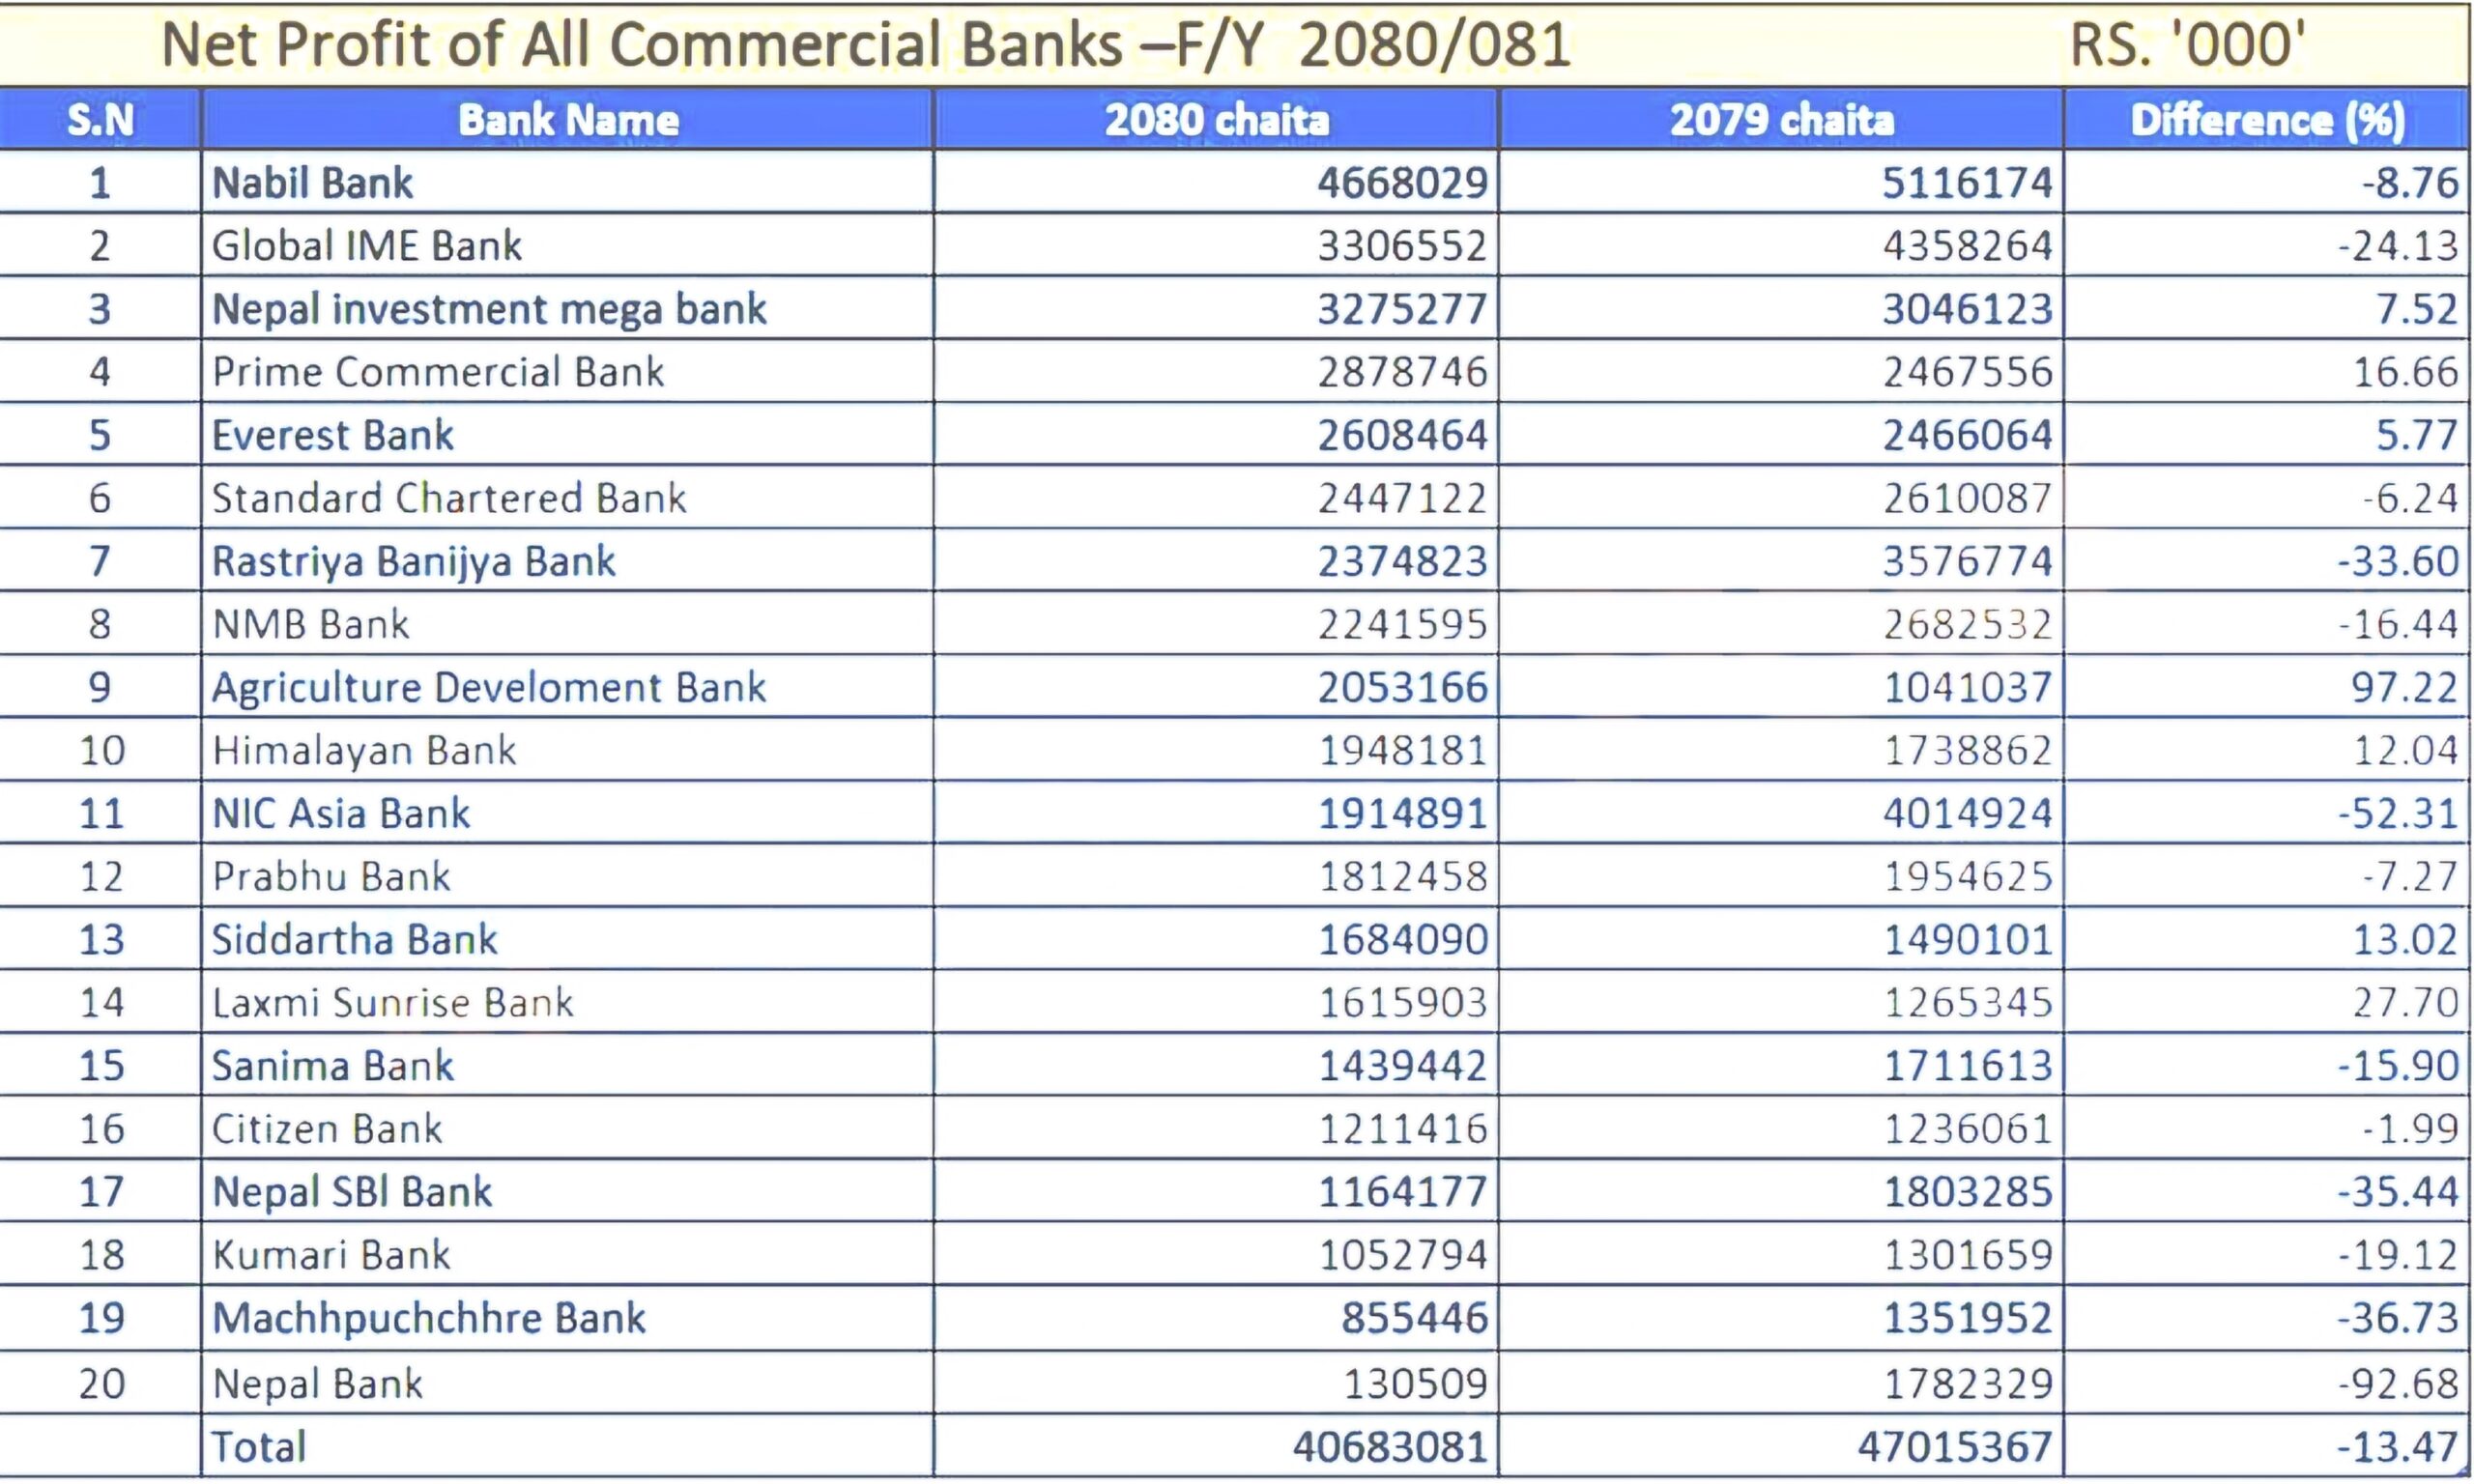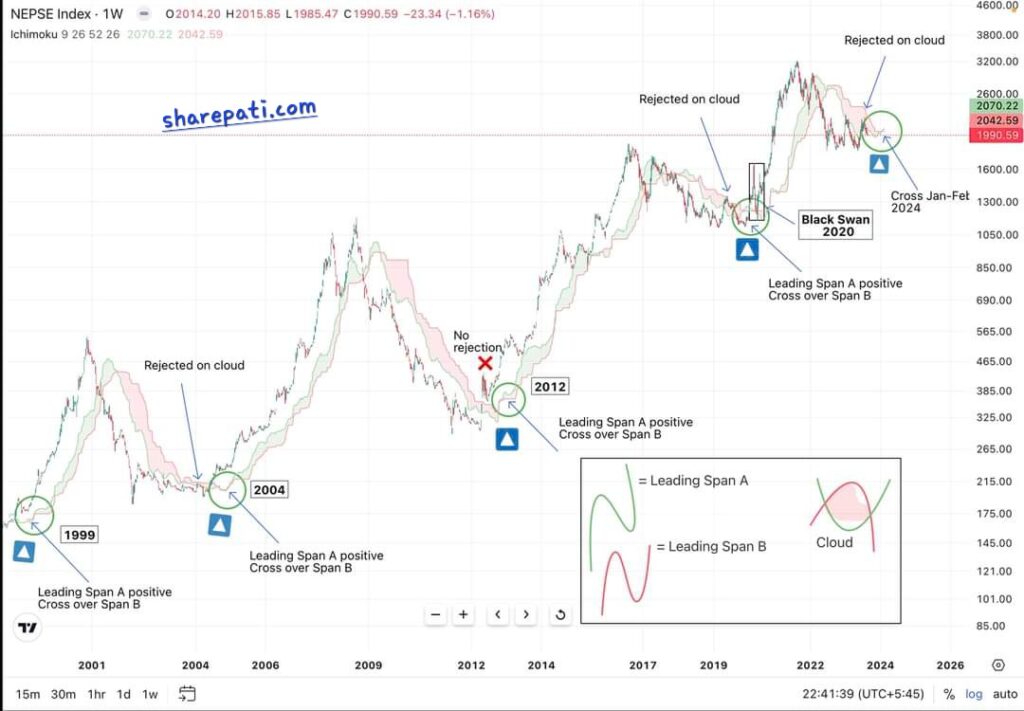
Except 2012, price has got rejected after retesting of weekly Ichimoku cloud in each market cycle. (Pointing out the reversal point after extreme drop)
As we can see in the chart below, Price has followed upside move after few months later of having positive crossover on Leading span A and Span B. (This is an evidence from each cycle as shown in the weekly chart below).
Now, price has rejected from the weekly cloud and we can see a positive crossover in Leading Spans which indicates possible trend change in Jan or Feb 2024.
If cycle follows, this drop should be the last drop before extreme rally in the market.
Remember: this is just a cycle analysis with help of ichimoku. Nothing is guaranteed as there could be several things to affect this idea. If plan works well, this should be our last drop which we also can see in our six month analysis as well.
Lets hope for the best and get prepared for the worst.
By: SUMAN THAPA
(Tactical Analyst, SharePati.com)
Have a good day @everyone 🤗🤗🤗🤗